Case Study - 2024
Data Monitoring Charts
EverBright needed a seamless data monitoring experience that empowered users to monitor their systems and optimize their solar energy use.
To achieve this, I built a user-centered solution focused on ease of understanding with multiple pathways to success.
My Role
Lead Product Designer
Company
EverBright
The Problem
EverBright previosly had a data monitoring chart system for solar energy only. The feature was not optimized for mobile applications, and struggled to draw user engagement.
We sought to improve engagement and trust, while also empowering users to optimize their energy systems and reduce carbon emissions.
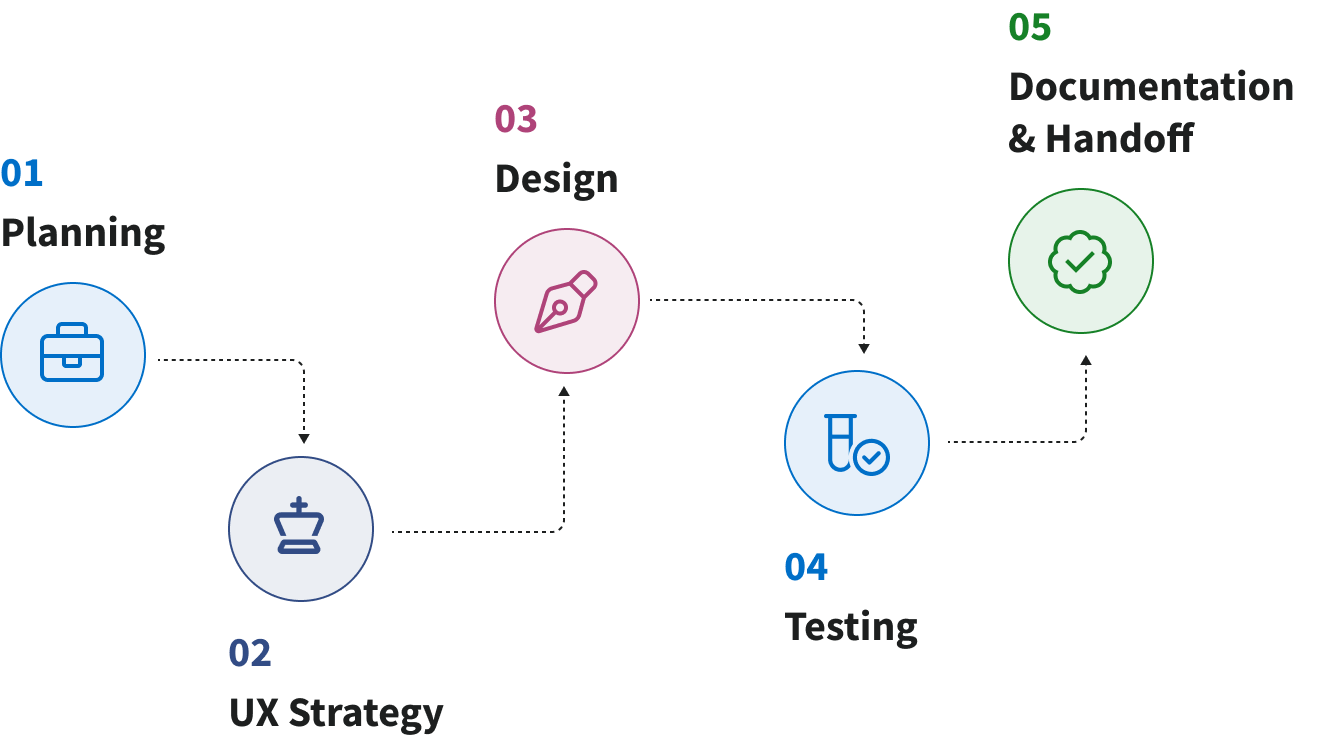
My Role
I had the pleasure of taking this project from start to finish. I was responsible for all planning, strategy, design, testing, documentation, and handoff.
Related Research
To kickoff this project, I leveraged research that had been completed as part of the redesign as a whole.

Competitive Analysis
In-depth analysis of 9 competitors & 47 features

Heatmap Analysis
Analysis of in-app user behavior & key interaction points

Contextual Inquires
Series of 6 interviews & analysis of themes
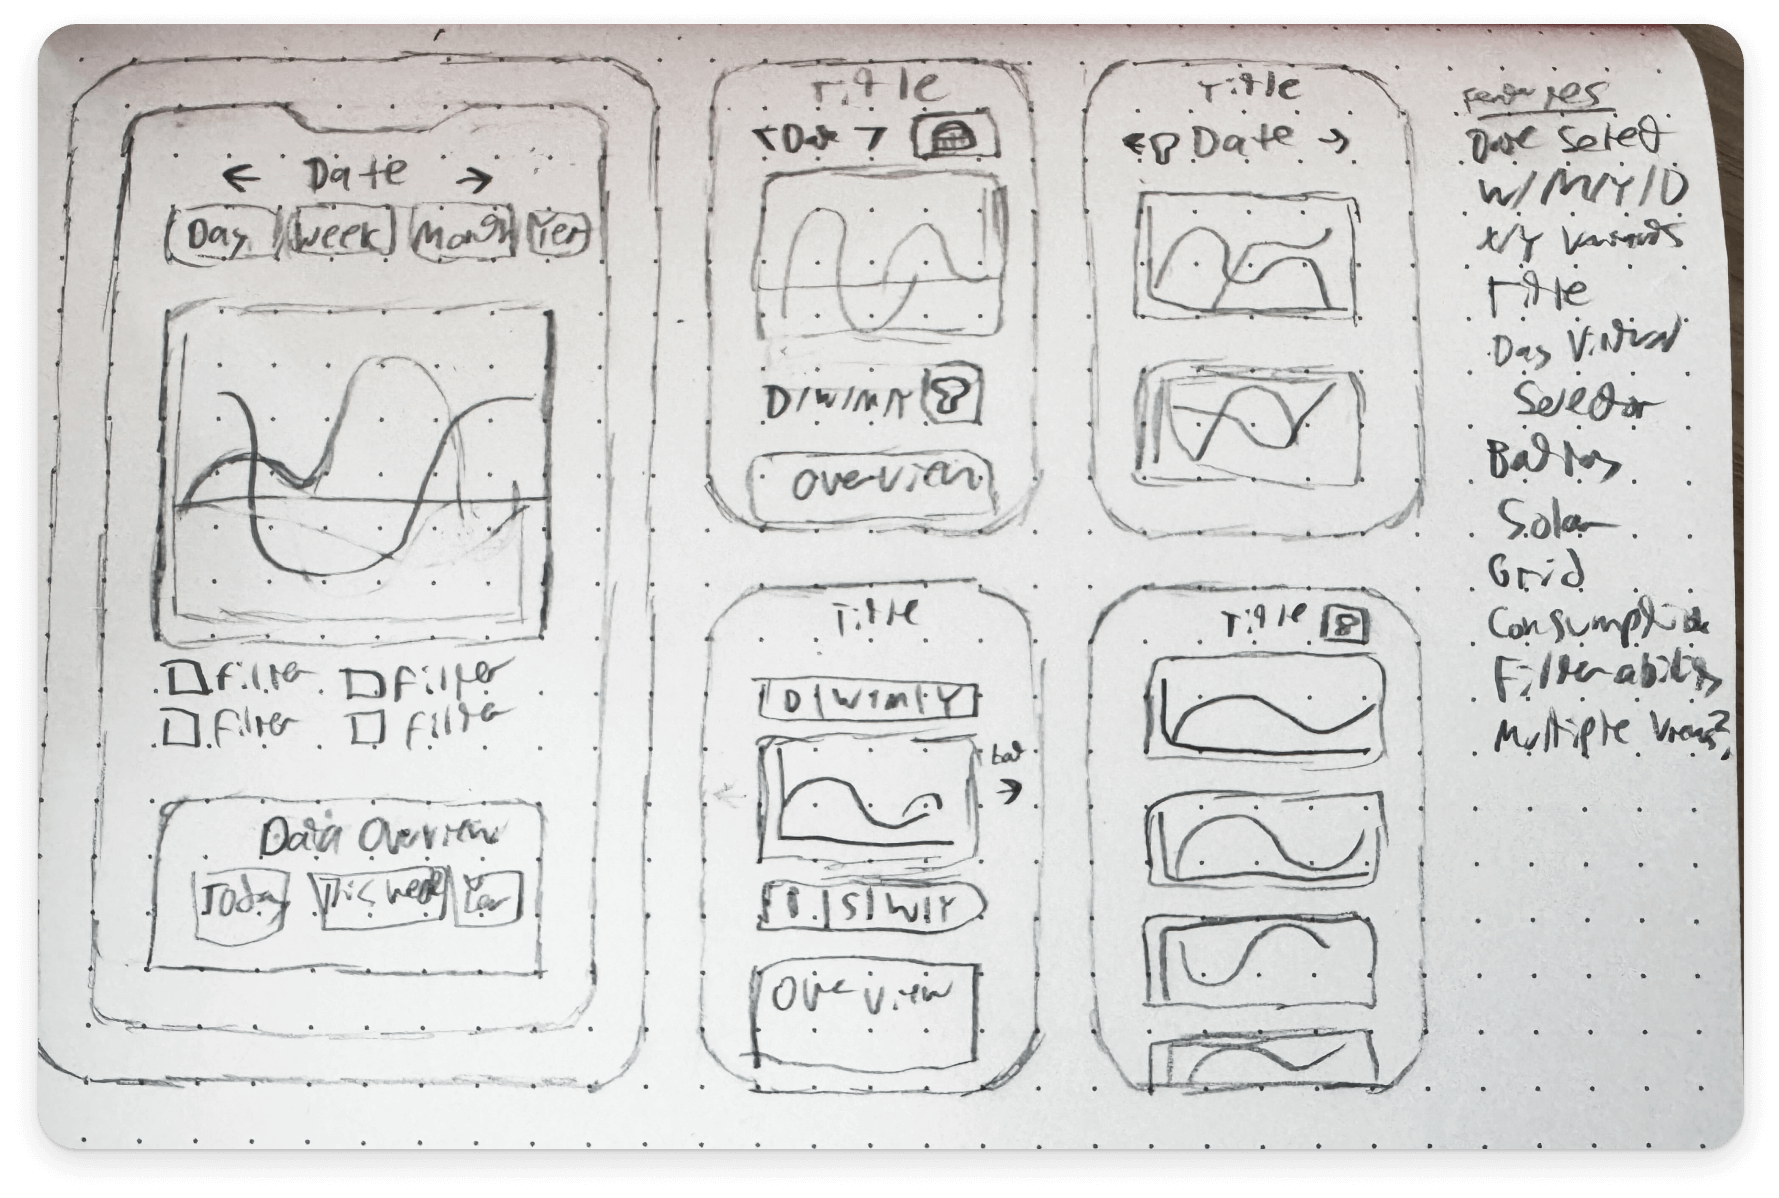
Initial Sketches & Wireframes
I went through several iterations of initial concept drawings to visualize multiple solutions to the problem.
I then translated three options to wireframes. These were reviewed by leadership to confirm direction, then I met with our engineers to identify technical constraints.
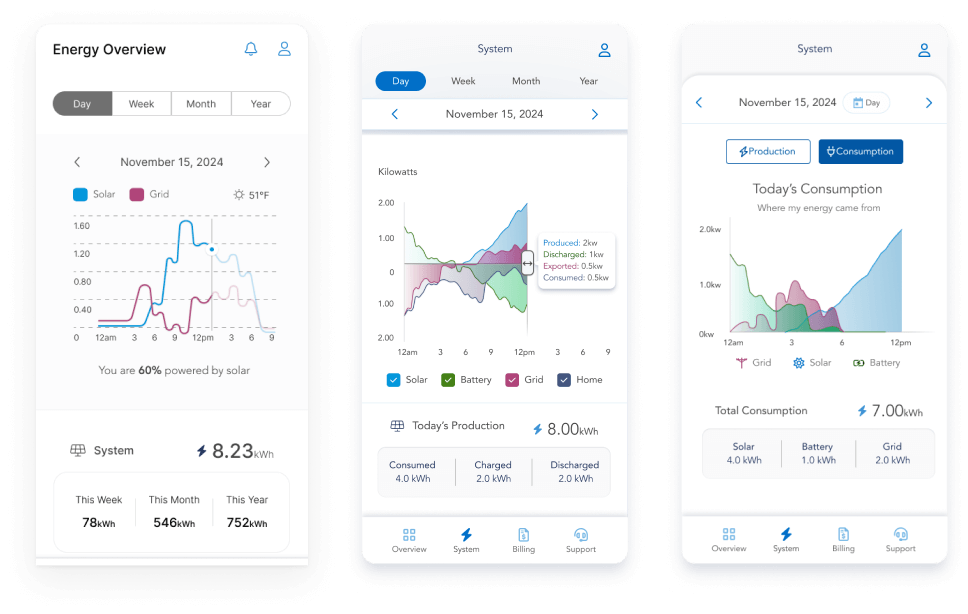
Initial Iterations
I started with lofi concepts. These were done in tandem with the visual language stage of the MyEverBright redesign.
This allowed me to get a head start on visualizing this feature while gaining valuable stakeholder feedback.
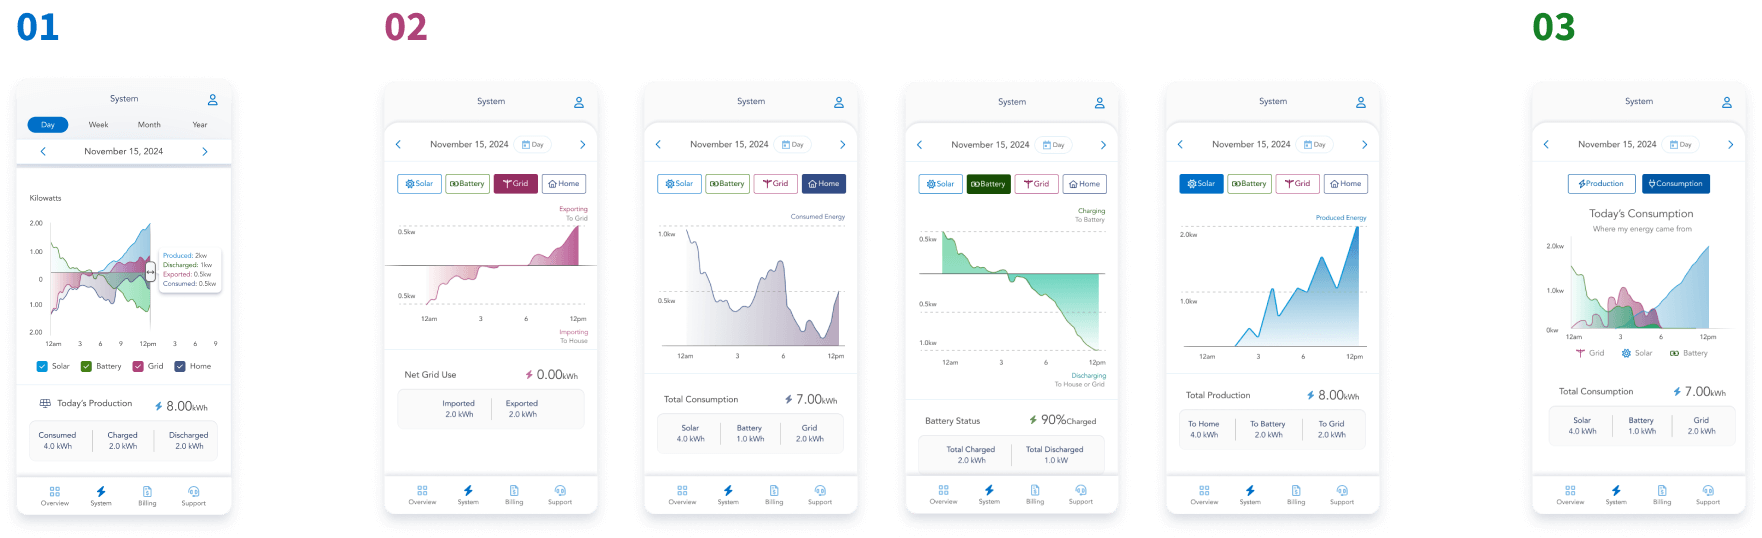
Usability & AB Testing
With my direction defined, I created 3 unique iterations of the feature, each solving the same problem in a different way.
Useberry was used to test these 3 iterations against each-other. Each test consisted of measurable actions to complete (quantitative), and a survey to gauge how users perceived the tasks (qualitative).
Final Iteration
Using the data from our test, I created a final iteration of the data monitoring feature.
Next, I met with our stakeholders and engineers to confirm scope and build out the timeline for development and launch.
Key Features
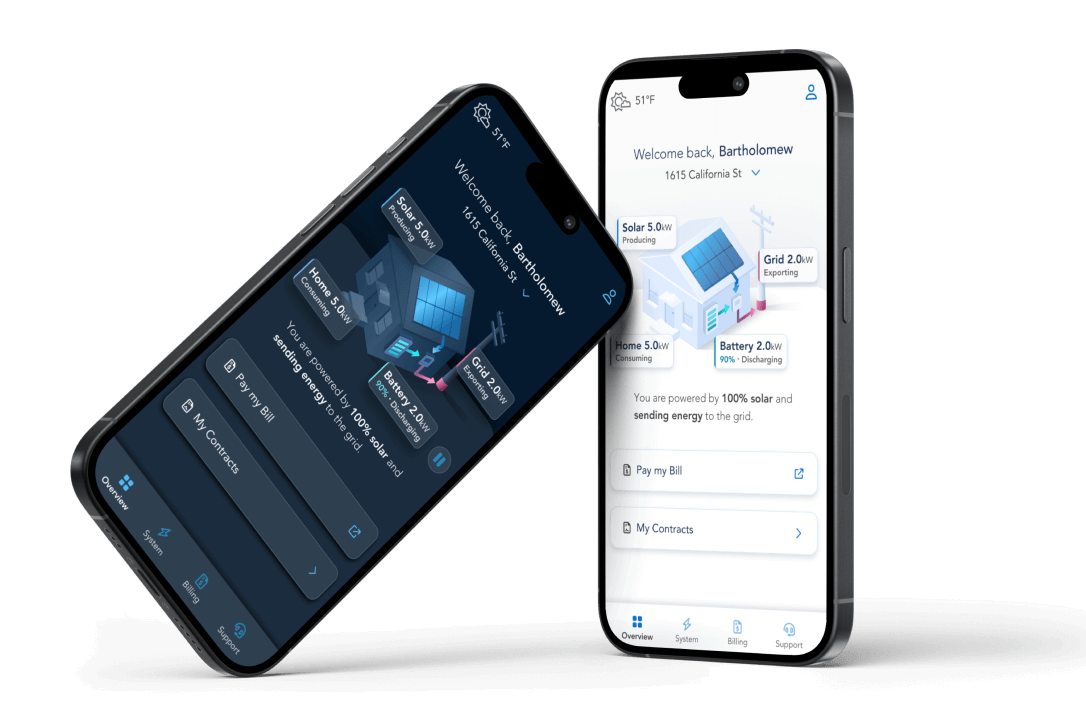
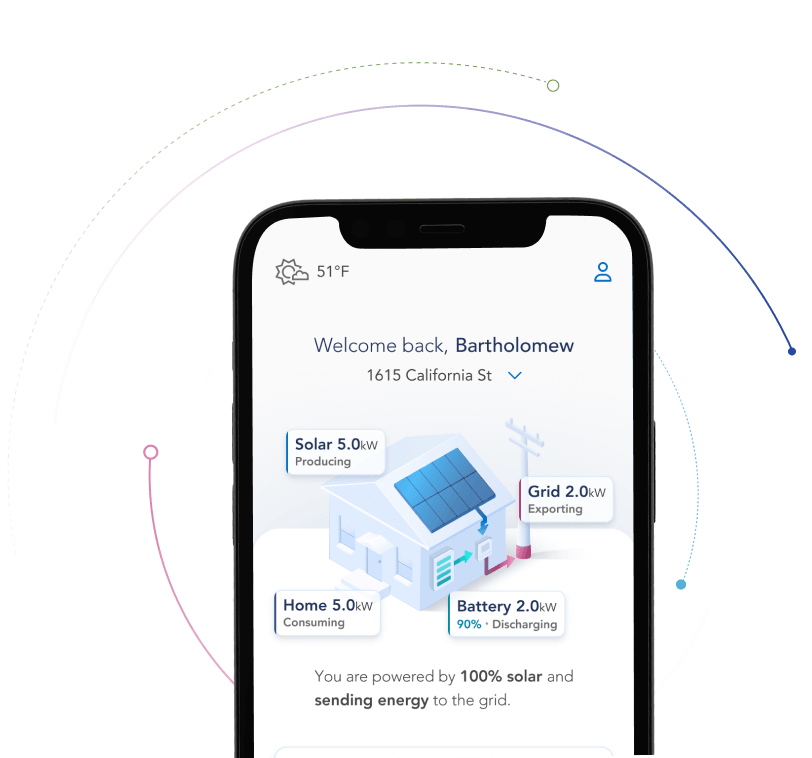
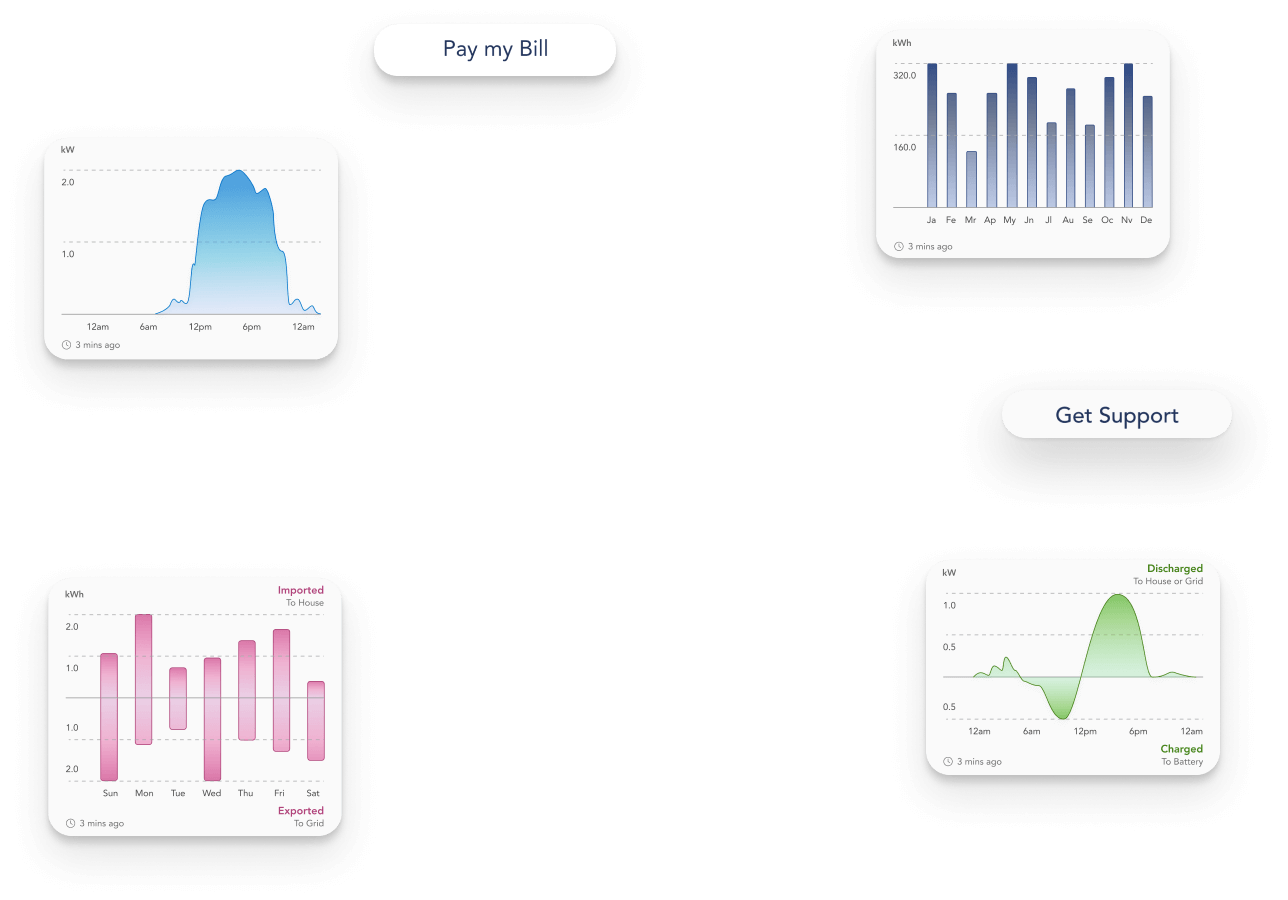
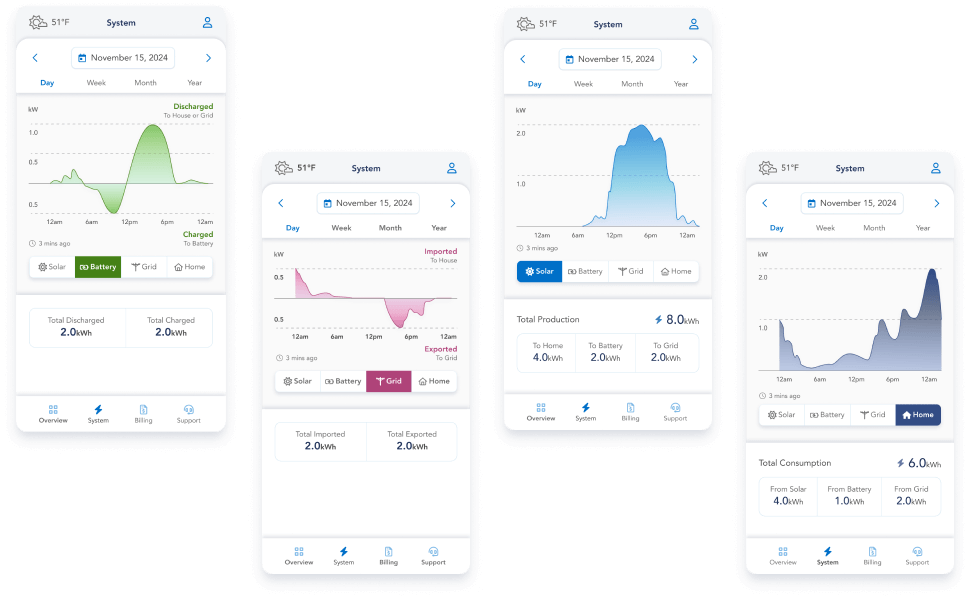
Clear and Approachable Data
To minimize cognitive load, the 4 data sets were broken into separate sections with color coordination to help ease cognitive load.
To help users see the relationship between data, a subtle animation was added to transitions between datasets.
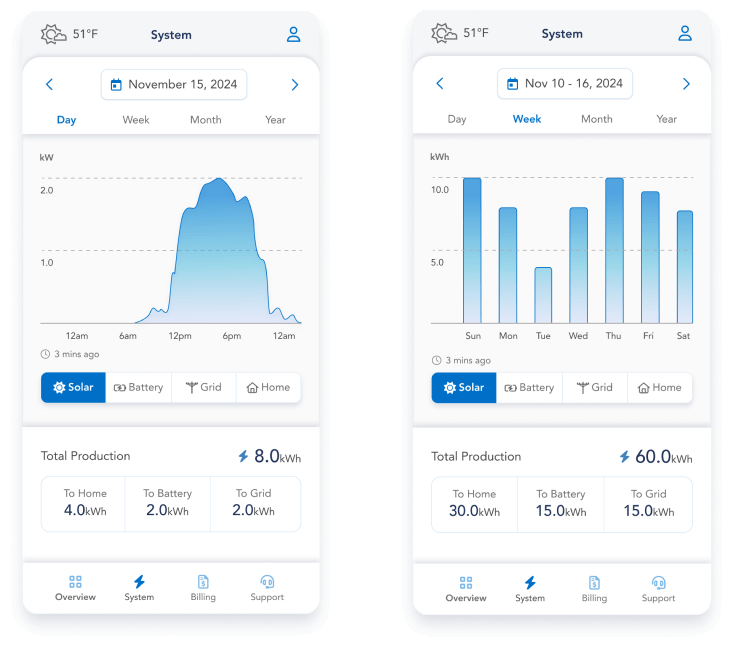
Multiple Routes to Success
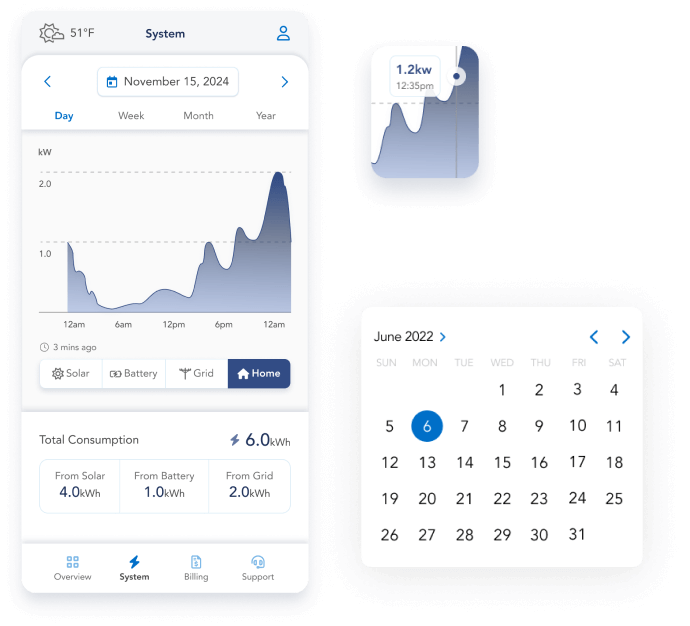
My goal with this feature was to give users maximal control with minimal UI complexity.
To achieve this, I gave high visibility to the easiest interactions, while allowing more robust tools to be discovered via interaction.
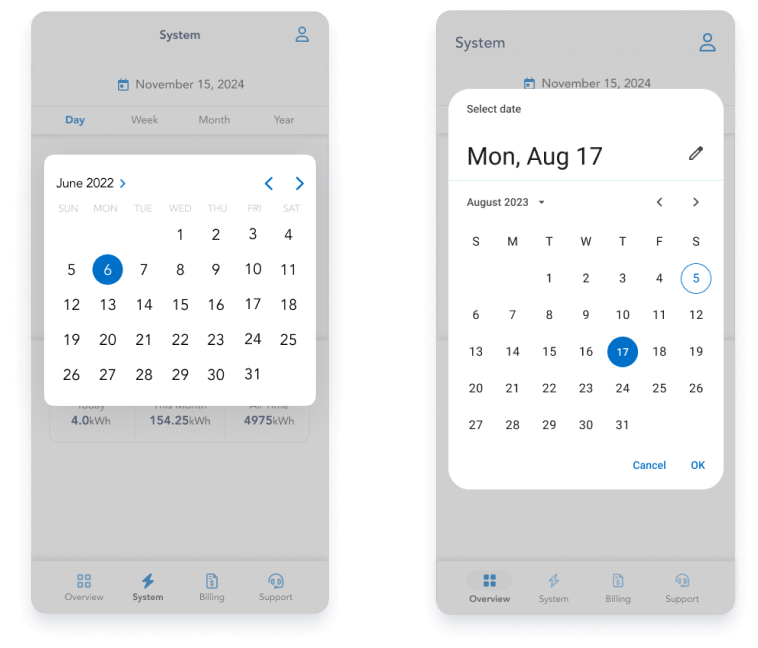
Native Mobile Optimization
I wanted this feature to feel natural on both Android and iOS devices, so I worked with our engineers to modify native modules.
This also cut down on the total custom components needed, which saved our engineers a lot of time.
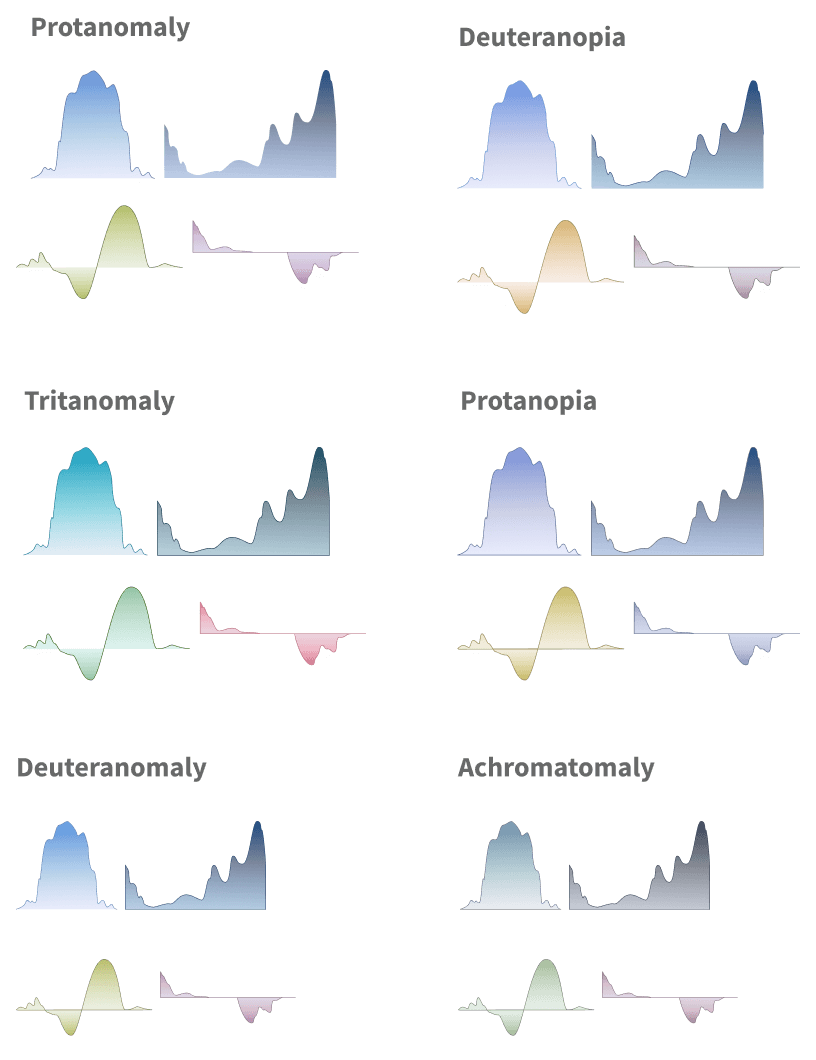
Coloration & Continuity
To help with ease of comprehension, I used coloration to differentiate data sets and connect them to their counter-parts on the Real-Time Power Flow chart.
I also ensured a pause button was included on launch so that users had control over the live animations.
Documentation & Handoff
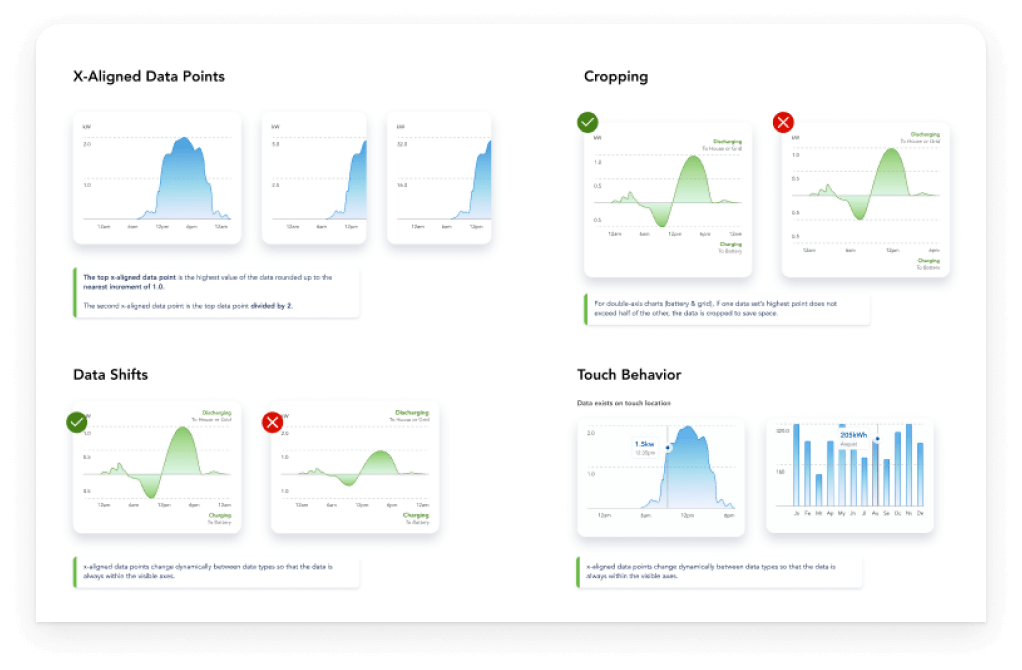
To help set our engineers up for success, I made our documentation as thorough as time allowed.
I included overviews, formula breakdowns, and annotated mockups for each element of the design.
Afterwards I met with the dev team at regular intervals to answer questions and give design feedback.
Application
This was the final key feature in our complete redesign of the MyEverBright application.
Next we set up analytics and created a plan for future data-centric iterations